

For over a decade, Bitcoin’s price action followed a remarkably predictable pattern. Every four years, the block reward halving cut new supply in half, triggering a supply shock that drove prices to new all-time highs roughly 12 to 18 months later. Traders built entire strategies around this cycle. Analysts made careers predicting it. And through three consecutive halvings — 2012, 2016, and 2020 — the pattern held with almost eerie consistency.
Then came the fourth cycle. And by April 2026, it is becoming clear that the old playbook no longer works the way it used to.
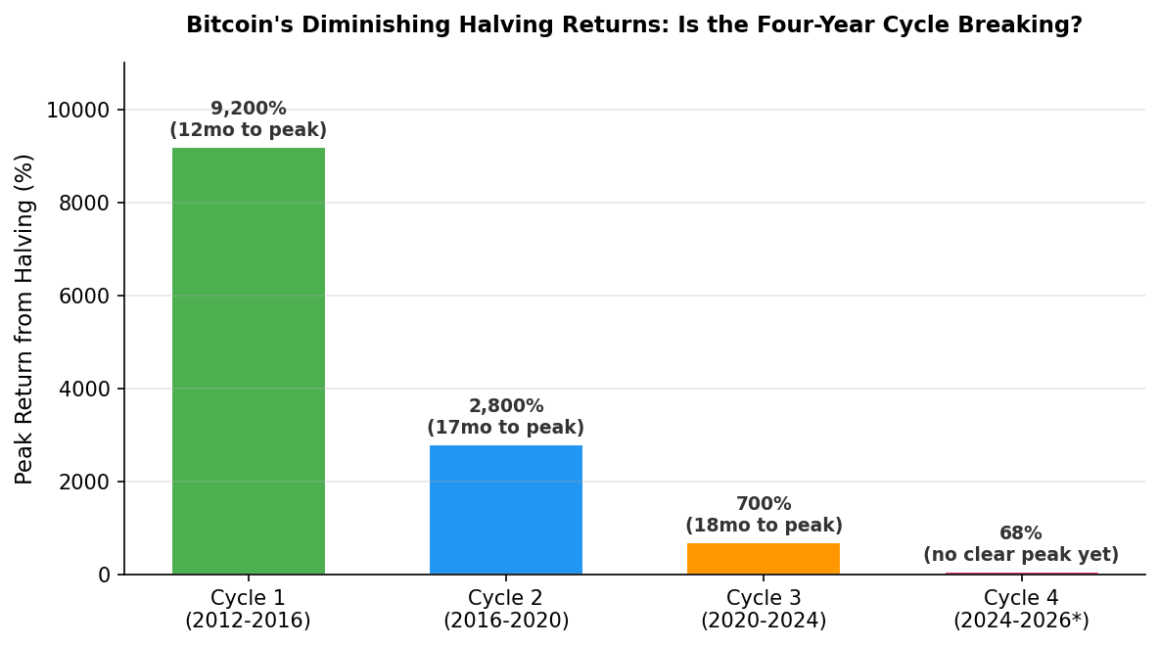
The Numbers That Should Worry Cycle Purists
The first halving in 2012 produced a peak return of approximately 9,200% from the halving price to the cycle high. The second cycle delivered roughly 2,800%. The third managed about 700%. Each cycle produced diminishing returns — but each still delivered a clear, identifiable bull run followed by an equally clear bear market.
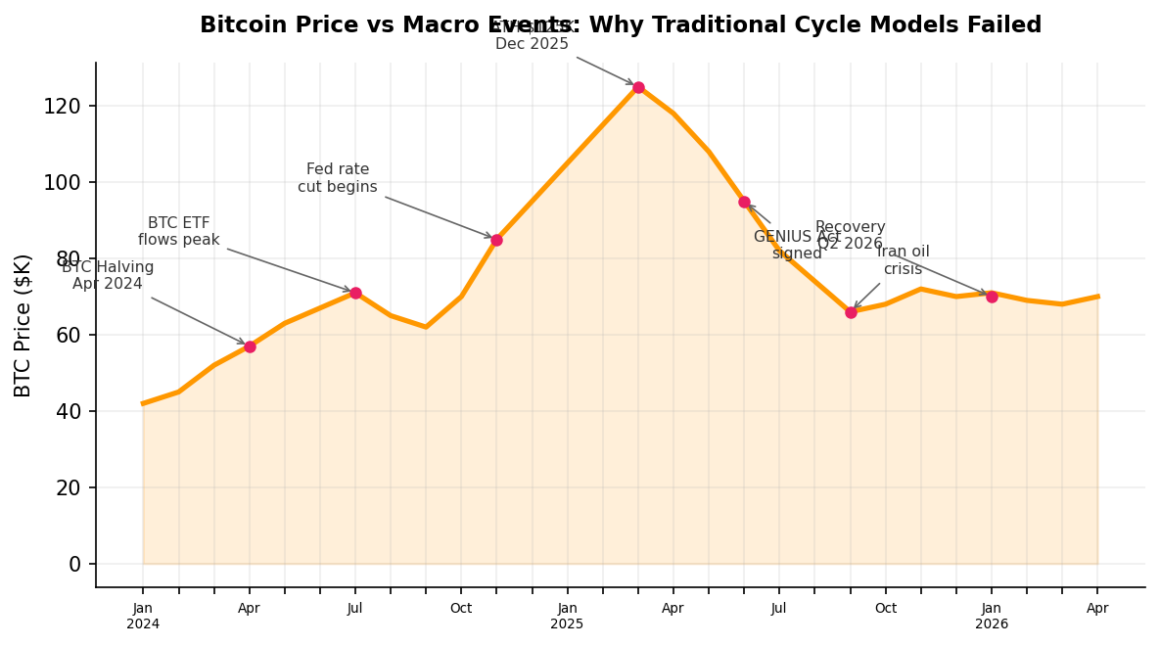
The fourth cycle, which began with the April 2024 halving, broke this pattern in a way that no simple adjustment can fix. Bitcoin did reach new all-time highs above $125,000 in December 2025 — roughly 17 months post-halving, right on schedule. But the subsequent price action has been nothing like previous cycles.
Instead of a clean blow-off peak followed by a gradual 80% drawdown over 12 months (the pattern of 2018 and 2022), Bitcoin experienced a series of sharp, macro-driven sell-offs and recoveries. The Iran–US conflict in early 2026 sent prices from $74,000 to $66,000 and back to $70,000 within three weeks. Federal Reserve policy signals moved the price 8–12% in single sessions. Oil prices above $100 per barrel triggered crypto liquidations that had nothing to do with on-chain fundamentals.
The cycle is not dead — but it has been absorbed into a larger, more complex system that the halving-only model was never designed to capture.
Why the Old Models Stopped Working
Three structural changes have fundamentally altered how Bitcoin’s price forms, making pure cycle analysis insufficient:
Institutional capital now dominates price discovery. When the first halving occurred in 2012, Bitcoin was traded almost exclusively by retail enthusiasts on unregulated exchanges. By 2026, BlackRock’s iShares Bitcoin Trust alone holds more BTC than the total new supply mined over the past two years. Institutional flows respond to macroeconomic signals — interest rates, dollar strength, risk appetite — not to four-year supply curves. When a sovereign wealth fund rebalances its portfolio, it moves Bitcoin’s price more than any halving ever could.
Bitcoin is now correlated with traditional risk assets. The 90-day rolling correlation between Bitcoin and the S&P 500 has risen from near zero in 2017 to consistently above 0.5 in 2026. During the March 2026 oil crisis, Bitcoin and GIFT Nifty futures fell in almost perfect tandem. This correlation means that macro events — wars, central bank decisions, energy shocks — drive Bitcoin’s price trajectory as much as, and sometimes more than, crypto-native factors.
Regulatory integration has changed the risk profile. The GENIUS Act (June 2025), OCC Interpretive Letter 1188 (December 2025), and the FDIC’s March 2026 joint guidance have transformed Bitcoin from a fringe speculative asset into a regulated investment class held by national banks. This legitimacy attracts a different investor base with different decision-making frameworks — frameworks that don’t care about halving dates.
What Actually Drives Bitcoin’s Price in 2026
If the halving cycle alone cannot explain Bitcoin’s 2026 price behavior, what can? According to recent market analysis, the most accurate forecasting models now weight five input categories, each contributing measurably to prediction accuracy:
- On-chain metrics (MVRV, SOPR, exchange flows): These remain relevant but their predictive power has declined from dominant to supplementary. They explain roughly 20–25% of short-term price variance, down from 40–50% in previous cycles.
- Macroeconomic indicators (oil prices, DXY, Fed funds rate, VIX): Now the single largest predictive category, explaining 25–30% of variance. The $80 Brent crude threshold has emerged as a critical inflection point for Bitcoin, as it directly affects Federal Reserve rate cut expectations.
- Institutional flow data (ETF inflows/outflows, CME futures positioning): Explains 15–20% of variance. Daily ETF flow data has become a leading indicator, with large outflows typically preceding price drops by 24–48 hours.
- Sentiment and news (social media, news headlines, regulatory announcements): Contributes 10–15%. Geopolitical events like the Strait of Hormuz closure show up in sentiment data before they manifest in price.
- Technical price structure (support/resistance, RSI, Bollinger Bands): The remaining 10–15%. Still useful for timing entries and exits, but insufficient as a standalone framework.
The Ensemble Approach: How Modern Forecasting Actually Works
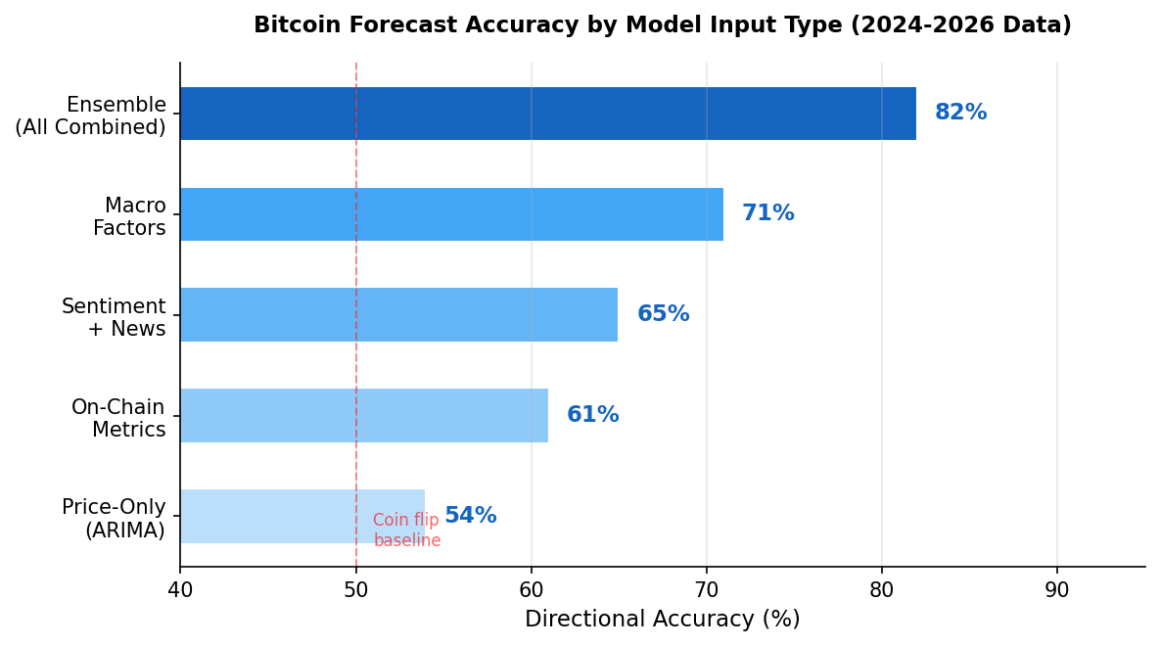
The shift from cycle-based prediction to multi-factor forecasting is not theoretical. Published research demonstrates that ensemble machine learning models — which combine multiple algorithms processing different data types simultaneously — significantly outperform single-input approaches.
A study published in Frontiers in Artificial Intelligence found that ensemble models combining LSTM neural networks with XGBoost achieved directional accuracy above 90% on daily Bitcoin predictions. A separate study in Engineering Applications of Artificial Intelligence reported that CNN-LSTM models with advanced feature selection reached 82.44% accuracy — a level that transforms Bitcoin trading from speculation into statistically grounded decision-making.
The key insight is that no single data source provides sufficient signal. Price-only models (like traditional ARIMA) barely outperform a coin flip at 54% accuracy. Adding on-chain data improves this to roughly 61%. Layering in macro factors pushes it to 71%. But combining all five input categories through ensemble methods reaches the 82%+ range — a level of consistency that institutional portfolio managers consider actionable.
What This Means for Investors Still Using Cycle Models
If you are still timing Bitcoin purchases based on halving dates and historical cycle patterns, the data suggests you are trading on a signal that explains less than a quarter of the price movement. It is like forecasting weather using only temperature data while ignoring pressure systems, humidity, and wind patterns. You will occasionally be right, but you will be right for the wrong reasons, and the model will fail precisely when accuracy matters most — during crisis events.
The practical implications are significant:
- Entry timing: Waiting for a “cycle bottom” based on historical patterns ignores that institutional and macro factors may prevent the 80% drawdowns that characterized previous bear markets. The floor in 2026 has been higher than cycle models predicted because ETF inflows create persistent buying pressure.
- Position sizing: Cycle models offer no framework for adjusting exposure based on macro risk. An investor with the same position size during the March 2026 oil shock as during a calm accumulation phase is taking dramatically different levels of real risk, even if both moments fall at the same point in the “cycle.”
- Exit strategy: The blow-off peak that defined previous cycles may not occur in the same form. If institutional rebalancing creates constant selling pressure above certain levels, the sharp parabolic top followed by an immediate crash may be replaced by extended consolidation ranges — which requires a completely different exit strategy.
Adapting Your Framework
The shift from cycle-based to multi-factor forecasting does not require abandoning halving data entirely. It means treating it as one input among many, weighted appropriately based on current market conditions. Tools like this forecast service, which use ensemble ML models processing on-chain, macro, sentiment, and technical data simultaneously, provide the kind of probabilistic output that reflects the complexity of Bitcoin’s current market structure.
A forecast that states “68% probability of Bitcoin trading between $68,000 and $73,000 over the next seven days, conditional on Brent crude remaining below $85” is fundamentally more useful than “we’re 22 months post-halving, so we should be near the cycle peak.” The first gives you actionable intelligence. The second gives you a narrative.
For investors willing to update their models, 2026 presents significant opportunity. The tools exist. The data is available. The research supporting ensemble approaches is peer-reviewed and replicable. The only barrier is the willingness to let go of a framework that worked beautifully for twelve years — and to accept that the market has evolved beyond it.
Looking Ahead
The four-year cycle may still influence Bitcoin’s long-term trajectory. Halving supply reductions are a real economic force, and their impact compounds over time as block rewards approach zero. But the cycle’s explanatory power will continue to diminish as institutional adoption deepens, regulatory integration expands, and macro correlations strengthen.
The investors who will navigate this transition successfully are those who treat forecasting as a multi-variable optimization problem rather than a pattern-matching exercise. They will combine on-chain data with macro indicators, weight institutional flow signals alongside technical analysis, and use AI-powered tools that process all of these inputs simultaneously rather than relying on any single framework.
The four-year cycle was a useful compass for Bitcoin’s first decade. For the second decade, you need a GPS.
More Stories
Bitcoin in 2026: Market Trends, Volatility, and What’s Shaping the Next Phase
BTCC: Bitcoin & Ethereum Futures Exchange 2026 – Fees, Security & Copy Trading
How Blockchain Communities Borrow Growth Tactics From Gaming Platforms